This post shows how to customize the login mask of the BI Launchpad.
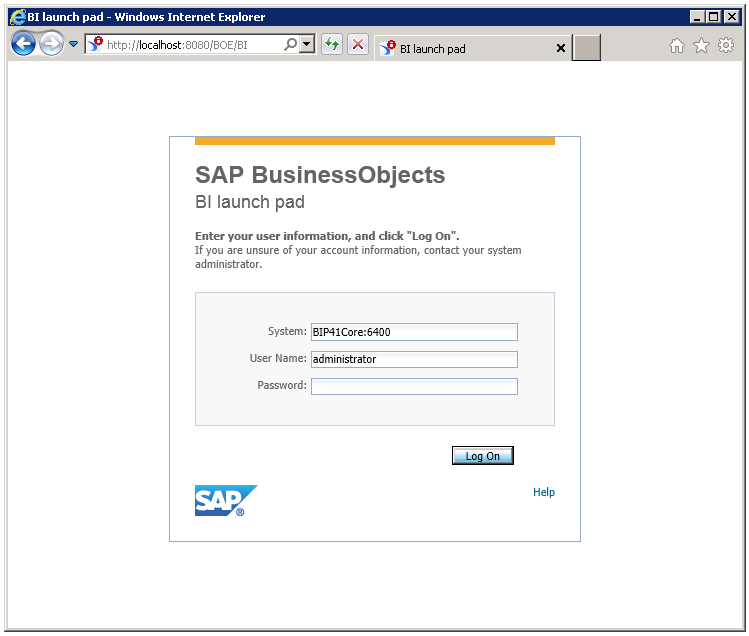
The default BI Launchpad login mask looks like this:
Changing the BIlaunchpad.properties
Some of the most common modifications for the login mask can be made in a file called BILauchnpad.properties in <CATALINA_HOME>webappsBOEWEB-INFconfigcustom. To start with your modifications, just create this file in this directory.
There are a lot of different parameters which you can set in this file (see the admin guide, chapter 18.2.1.2). Let me explain those parameters which change the login mask (by the way – if you want to test these steps, I recommend to use the tomcat manager to reload the web app – this is faster than restarting the tomcat service).
Setting the parameter app.custom.product.name=c-BIP BI platform results in:

Setting the parameter app.name.short=Welcome to the BI Launchpad at c-BIP results in:

Setting the parameter authentication.visible=true to get this login mask adds a drop-down field to change the authentication type:

Setting the parameter authentication.default=secWinAD (only visible if authentication.visible=true) changes the default authentication type:

Setting the parameter cms.visible=false removes the CMS text field:

Setting the parameter cms.default=@cBIP (only visible if cms.visible=true) changes the default system name – this is useful when you change the cluster name in the CCM:

Another parameter I want to mention here is app.url.name – this parameter changes the URL for the BI Launchpad (be careful: If you try to call the launchpad with :/BOE/BI, you will see an error):
Setting the parameter app.url.name=/c-BIP results in:
![]()
These are the most common parameters to change in the BIlaunchpad.properties.
Changing the logo
The logo in the left bottom corner can be replaced in <CATALINA_HOMEwebappsBOEWEB-INFecplipsepluginswebpath.InfoViewwebimages – just replace the file called SAP_logo_reg.png and restart Apache Tomcat.

And also the banner icon is changed:

Changing the default logon instructions
The default logon instructions can be changed in a file called LogonResources.properties – but this is hidden very well into the file structure: It is located in <CATALINA_HOME>webappsBOEWEB-INFeclipsepluginswebpath.BICoreWebwebWEB-INFlibBICoreWeb.jar. Just change the file extension from jar to zip, then open it and navigate to combusinessobjectsbipcoreweblogoninternalLogonResources.properties. Change the parameters called logon.firstInstruction and logon.secondInstruction:

This results in:

Changing the Cascading Style Sheet
If you want to use a custom style sheet, you can modify the default.css in <CATALINA_HOME>webappsBOEWEB-INFeclipsepluginswebpath.InfoViewwebcss.
Important
Be careful with all of these changes – especially the logon instructions are hidden deep into the system, so please do these steps on a sandbox or test system first.
If your login mask looks like you wish, then (and this is an important step) copy BIlaunchpad.properties to <BIP_INSTALL_DIRECTORY>SAP BusinessObjects Enterprise XI 4.0warfileswebappsBOEWEB-INFconfigcustom.
You should also replace the logo files SAP_logo_reg.png in <BIP_INSTALL_DIRECTORY>SAP BusinessObjects Enterprise XI 4.0warfileswebappsBOEWEB-INFecplipsepluginscom.businessobjects.webpath.InfoView.jarwebimages.
Also, modify the LogonResources.properties in <BIP_INSTALL_DIRECTORY>SAP BusinessObjects Enterprise XI 4.0warfileswebappsBOEWEB-INFecplipsepluginscom.businessobjects.webpath.BIPCoreWeb.jarwebWEB-INFlibBIPCoreWeb.jar.
Finally, run the wdeploy tool to be sure not to loose these changes.


